Here we provide adaptable infographics highlighting the nature and process of science that can be helpful to you and your students. Their specific applications for different grade levels are addressed within the teaching guides: 3-5, 6-8, 9-12, and 13-16.
 The Science Checklist (PDF) looks at what makes science science — the key features that set science apart from other human endeavors.
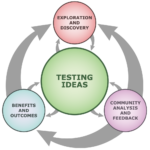
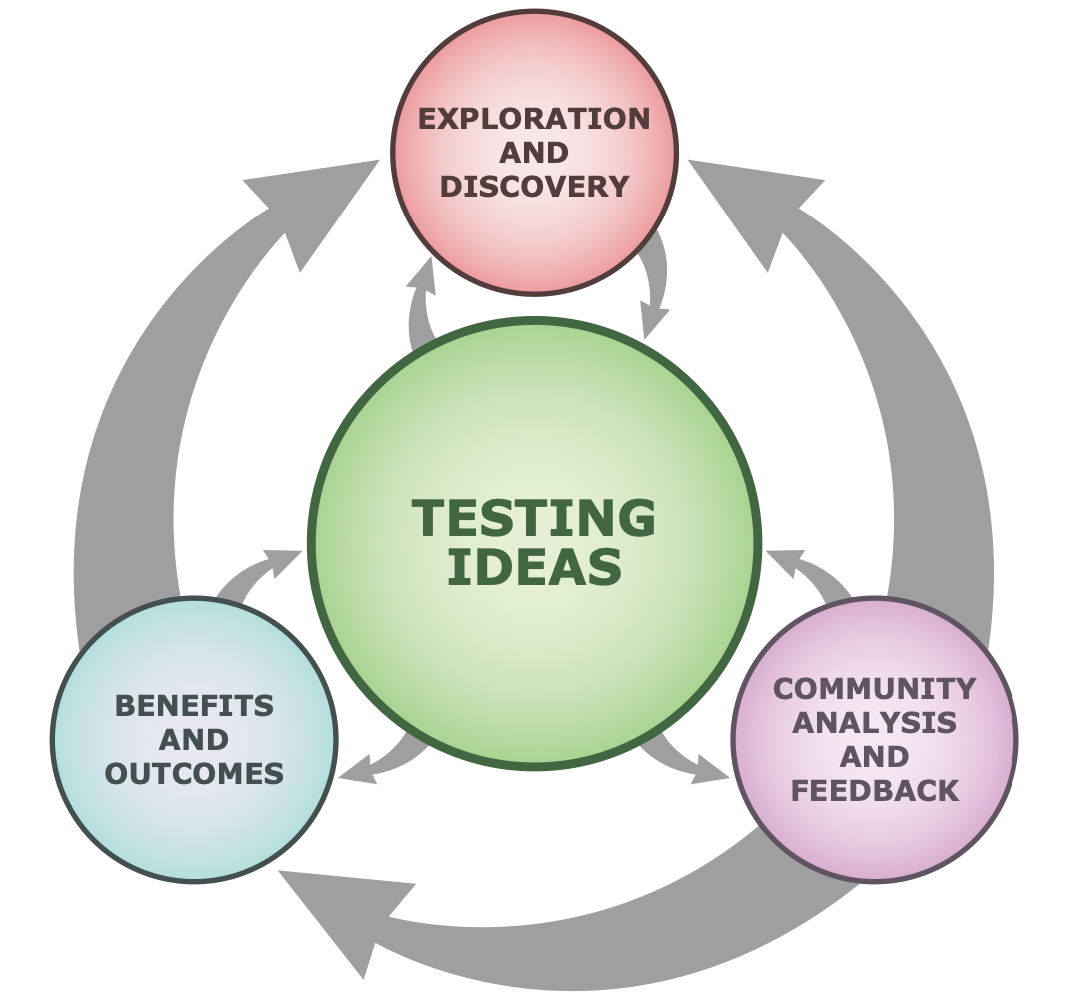
The Science Flowchart looks at how science really works. It portrays scientific inquiry as a dynamic process:
- The Simple Science Flowchart in English or Spanish (PDF) depicts the four primary components of the process for younger learners. Also available:
 Science Flowchart for grades K-2 (PDF) — a useful tool for teachers of K-2 students identifying the primary areas of the process best covered at these grade levels
- Science Flowchart for grades 3-5 (PDF) — useful for both teachers and their students with modified language appropriate for students at these grade levels. Also available as a 25″x37″ poster.
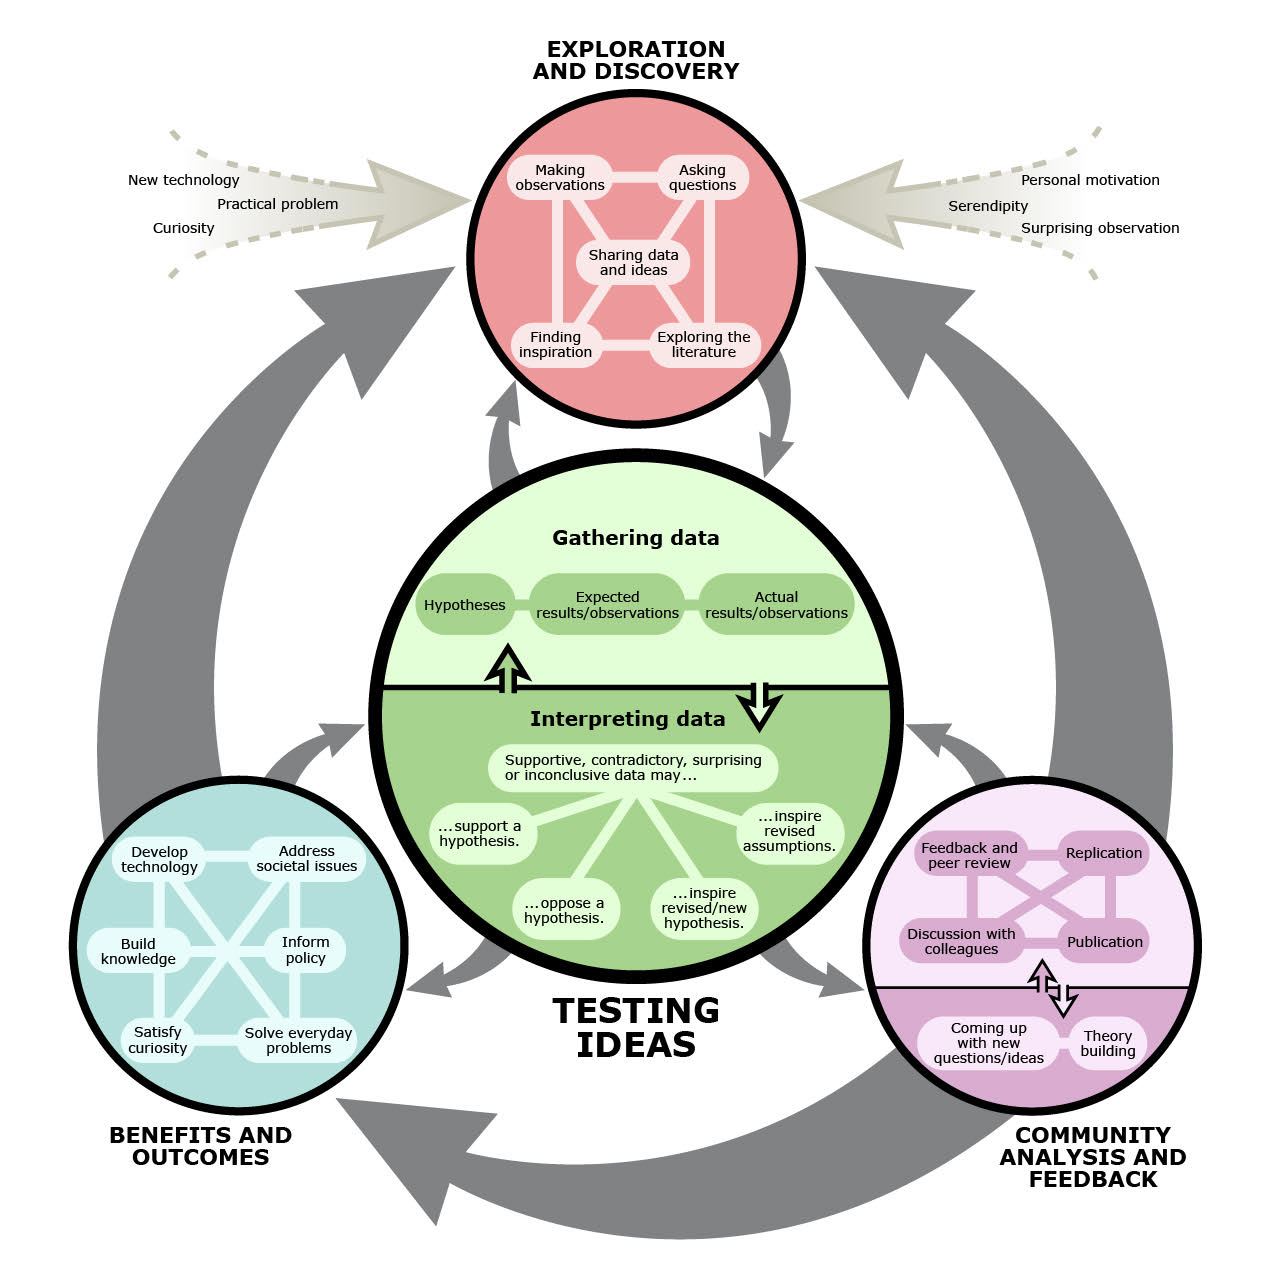
- The Complex Science Flowchart (PDF) depicts a detailed view of the iterative process of science. It is available in:
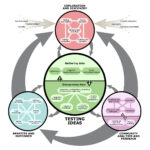 English (color, black & white, text description for learners with vision loss, 37″x25″ landscape poster, 25″x37″ vertical poster). Blank versions (color, black & white) allow your students to fill in the activities of their own investigations.
- Spanish (single page, 18″x24″ poster)
- French
- Japanese
- Swahili
 German
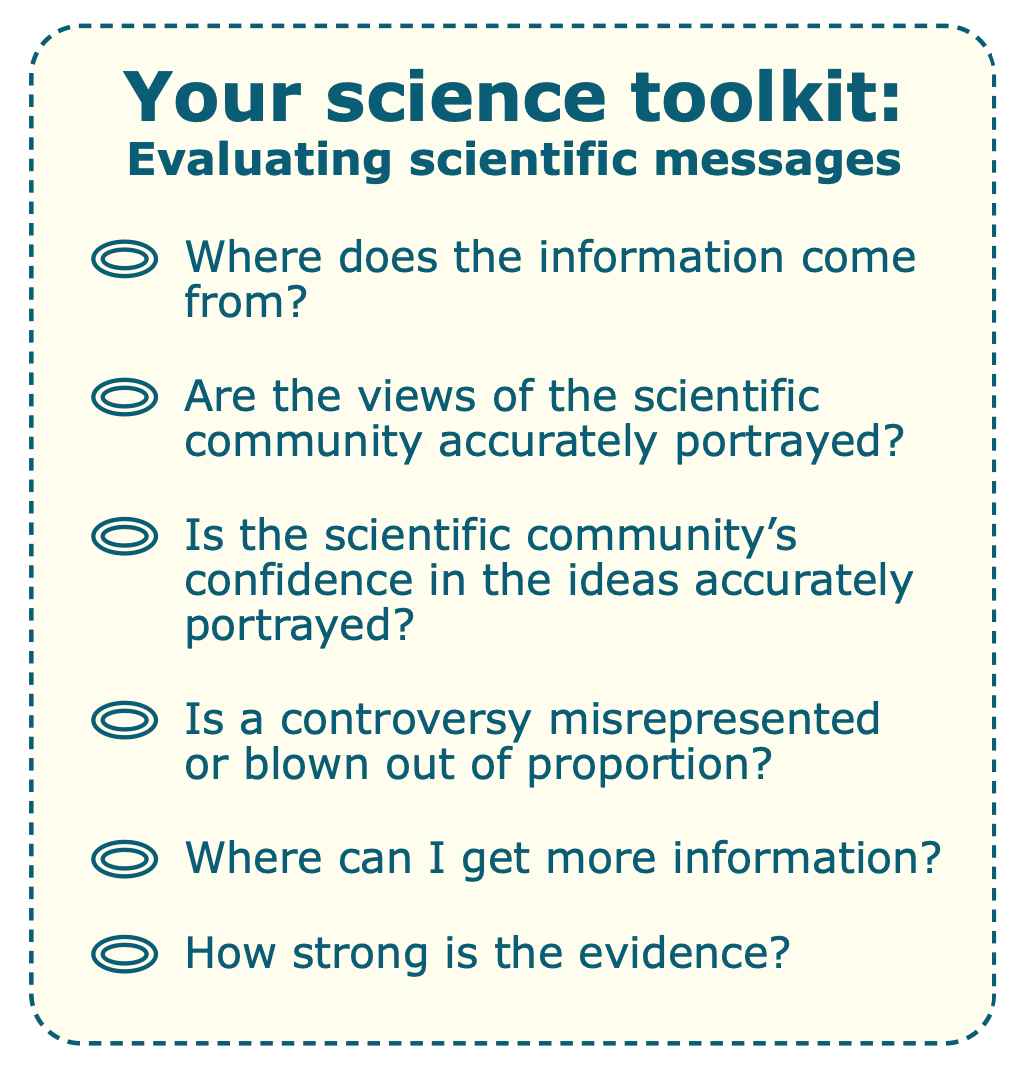
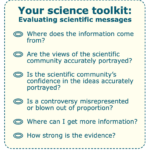
Your Science Toolkit (PDF) provides a set of questions that can help your students to apply critical thinking skills, evaluate media messages about science, and improve their own decision-making.