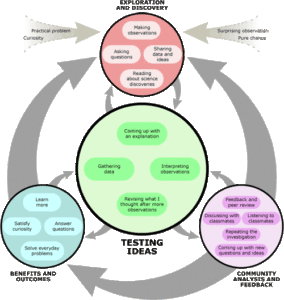
To introduce the flowchart, begin with one of the starter activities and then ask the students to discuss how what they did is similar to what scientists do. List their ideas on the board and order them so that they reflect the students’ process. For instance, in Mystery boxes, they may have (1) made observations, (2) shared their observations, (3) come up with an explanation (hypothesis) of what was in the box, (4) recorded their idea, (5) shared their hypotheses, (6) made further observations to decide which hypothesis was the best explanation, and (7) presented their findings to the rest of the class.
 Then, introduce the Science Flowchart for 3-5 as a diagram of how scientists work. Students can then highlight what they did on a copy of the flowchart and trace the path of their investigation. It is important to recognize that not all students will have done each of these steps in the same order. Try to encourage students to be explicit about what they did. Emphasize that scientists often approach problems in different ways; similarly, different students may have different pathways.
The Science Flowchart can provide a reference for your students throughout the school year. They should notice that their pathways differ depending on many factors, including the types of investigations in which they are engaged.
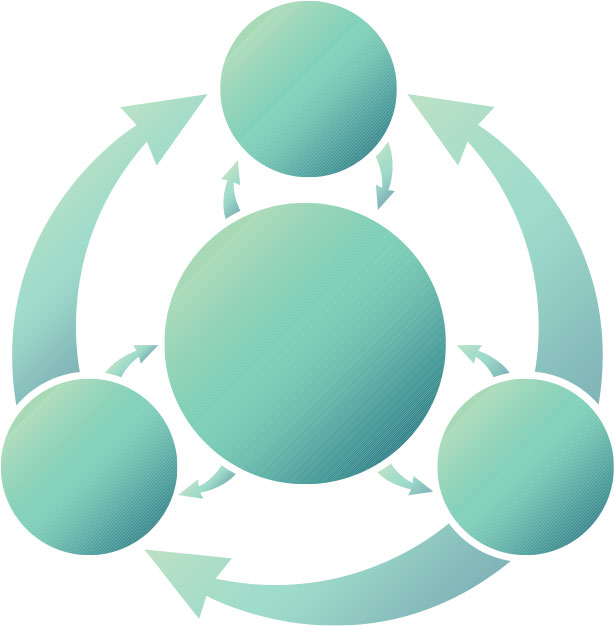
Note: Not all students will be able to grasp the details portrayed in the Science Flowchart for 3-5. Alternatively, students at the 3rd grade level can use the primary sections of the simplified Science Flowchart directly: exploration and discovery, testing ideas, community analysis and feedback, and benefits and outcomes. They can be asked to express what they did that scientists do and then to suggest where those activities would be placed on the Science Flowchart.
