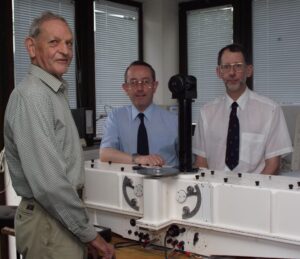
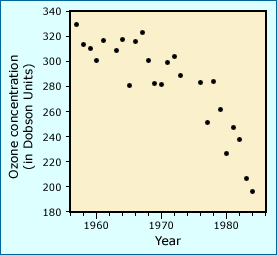
Researcher Joseph Farman had been collecting atmospheric data at Halley Bay, Antarctica since 1957. Every year he sent a team of research assistants to measure ozone levels and concentrations of trace gases like CFCs. In 1982, his ozone reading showed a dramatic dip — around 40%. Rather than being alarmed, he was skeptical of the data and thought it must be an instrument malfunction. The machine was notoriously difficult to keep working in the severe Antarctic cold, and this particular instrument was old. Besides, he reasoned, NASA scientists had satellites collecting atmospheric data from all over the world, and they hadn’t reported any anomalies. Farman’s instrument was ground-based and only had one data point — the part of the atmosphere directly above it. Surely NASA’s thousands of data points would have revealed a drop in ozone if there had been one. Farman ordered a new instrument for next year’s measurement.

But the following year, Farman still found a drastic decline. He dug up his old data and found that the decline had really started back in 1977. Now Farman suspected that something odd was happening strictly over Halley Bay, leaving other areas unaffected. So the next year, his team took measurements from a location 1,000 miles northwest of Halley Bay. Even there, a large decline in ozone occurred. The mounting evidence was undeniable. Farman decided it was time to publish his data.

Why hadn’t NASA’s satellite caught this plunge in ozone levels? Much to their chagrin, NASA scientists realized that they did have data indicating ozone loss but had overlooked it. Since their satellite recorded data 24 hours a day, it supplied scientists with information much faster than they could analyze it. To deal with this deluge, a data processing program had been set up to filter out all measurements below or above cut-off values that were considered to be impossible for actual ozone measurements. This program was based on the assumption that these “impossible” measurements were due to instrument malfunctions. The two groups of scientists (Farman’s group and the NASA group) looked at the same data, but interpreted them differently because of their data analysis techniques. Farman’s group concluded that the data reflected real changes in ozone, while the NASA group had concluded that the data reflected an instrument problem.
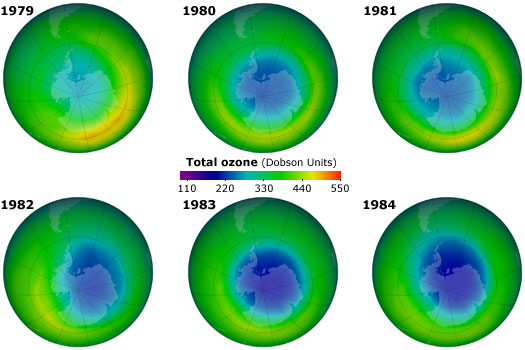
Farman’s evidence showed NASA’s group the problem with their data analysis procedure. When NASA scientists reanalyzed their Antarctic measurements, they discovered a gigantic hole in the ozone layer — a region of depleted ozone the size of the United States! Our protective shield from solar radiation had already been damaged even more than scientists had thought possible. The ozone depletion in Antarctica was real, but why was it so much larger than any of the models had predicted?

The initial results regarding ozone levels over Antarctica highlight the fact that raw data must be analyzed and interpreted before their implications can be understood. To learn more about this process, visit Digging into data.
