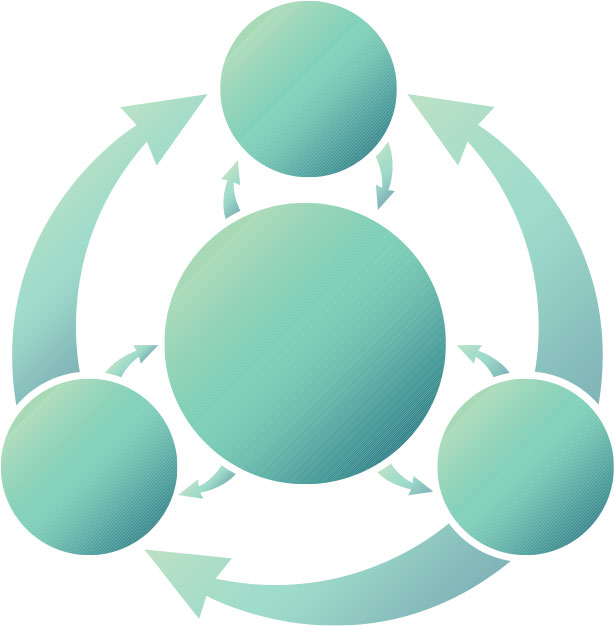
The flowchart represents the real process of scientific inquiry. It shows that the process of science is not a linear recipe, but a non-linear, dynamic, and iterative process. It shows that:
- There are many routes into the process of science, like making a surprising observation.
- Testing ideas is at the heart of science.
- Science relies on a community, both within a research groups and across all of science.
- Science is intertwined with society and affects our lives every day.
The activities on the flowchart are organized into four main areas or topics, each represented by a colored circle:
- Exploration and discovery (pink circle)
- Testing ideas (green circle)
- Community analysis and feedback (purple circle)
- Benefits and outcomes (blue circle)
Each of these areas has subtopics within it and is connected to the other areas with arrows, showing that scientists can move between these different sorts of activities in many different orders and ways.
We’ll start with Exploration and discovery. There are many different activities that can start a scientist’s journey of exploration and discovery. These different activities are shown as arrows leading into the Exploration and Discovery area. They include:
- New technology
- Curiosity
- Practical problem
- Personal motivation
- Serendipity
- Surprising observation
Within the Exploration and Discovery area, scientists may engage in the following activities:
- Making observation
- Asking questions
- Sharing data and ideas
- Finding inspiration
- Exploring the literature
These activities are all interconnected by lines, indicating that scientists move back and forth between them as they explore.
Next, we’ll examine the Testing ideas area. This is the largest of the four areas and is at the center of the diagram. It is divided into two sections:
- Gathering data
- Interpreting data
These two areas are connected by arrows, showing that scientists move back and forth between them as they test ideas.
The Gathering data section includes three entities that are connected linearly:
- Hypotheses
- Expected results or observations
- Actual results or observations
This implies that, in science, hypotheses generate expected results or observations, and these can be compared to actual results or observations in order to test ideas.
The Interpreting data section includes one statement (“Supportive, contradictory, surprising, or inconclusive data may …”) that leads to four possible outcomes:
- support a hypothesis
- oppose a hypothesis
- inspire a revised/new hypothesis
- inspire revised assumptions
Next, we’ll examine the Community analysis and feedback area. This is also divided into two sections. The top section includes four small-scale activities in which scientists engage:
- Feedback and peer review
- Replication
- Discussion with colleagues
- Publication
These activities are all interconnected by lines, indicating that scientists move back and forth between them as they interact with one another in the scientific community.
The bottom section of the Community analysis and feedback area includes two large-scale activities in which scientists engage:
- Coming up with new ideas/questions
- Theory building
These activities are connected by a line, indicating that scientists move back and forth between them.
The top and bottom sections of the Community analysis and feedback area are connected by arrows, indicating that small-scale interactions within the scientific community (feedback and peer review, replication, etc.) inform large-scale community activities (such as theory building) and vice versa.
Finally, we’ll examine the Benefits and outcomes area. This includes six possible outcomes of the process of science. Engaging in the scientific process can help us:
- Develop technology
- Address societal issues
- Build knowledge
- Inform policy
- Satisfy curiosity
- Solve everyday problems
Again, these outcomes are all interconnected by lines, indicating that these outcomes can also impact each other (for example, a new technology could help us address a societal issue).
Return to the interactive flowchart.
