Grade Level(s):
- 9-12
Source:
- Collins, Jennifer
Resource type:
- lab activity
Discipline:
- Life Science
Time: Two class periods
Overview
Students "travel" to the Greater Antilles to figure out how the Anolis lizards might have evolved there. Students make observations, ask questions, share data, form hypotheses, generate expectations, get more data, interpret them, and test their ideas.

- [What is science?: Grades 6-8] Science works only with testable ideas. (P2, P3, NOS2)
- [What is science?: Grades 9-12] Science is both a body of knowledge and the process for building that knowledge. (NOS5)
- [What is science?: Grades 9-12] Science aims to build explanations of the natural world. (P3, P6)
- [What is science?: Grades 9-12] Science works only with testable ideas. (P2, P3, NOS2)
- [What is science?: Grades 9-12] Scientists strive to test their ideas with evidence from the natural world; a hallmark of science is exposing ideas to testing. (P3, P4, P6, P7, NOS2)
- [How science works: Grades 9-12] The process of science involves observation, exploration, testing, communication, and application.
- [How science works: Grades 9-12] Scientists test their ideas (hypotheses and theories) by figuring out what expectations are generated by an idea and making observations to find out whether those expectations are borne out. (P4, P6)
- [How science works: Grades 9-12] Scientists can test ideas about events and processes long past, very distant, and not directly observable.
- [How science works: Grades 9-12] Scientists test their ideas using multiple lines of evidence. (P6, NOS2)
- [How science works: Grades 9-12] Scientists often try to generate multiple explanations for what they observe. (P7)
- [How science works: Grades 9-12] Scientists use multiple research methods (experiments, observational research, comparative research, and modeling) to collect data. (P2, P3, P4, NOS1)
- [How science works: Grades 9-12] Scientists look for patterns in their observations and data. (P4, P5, NOS2)
- [How science works: Grades 9-12] Analysis of data usually involves putting data into a more easily accessible format (visualization, tabulation, or quantification of qualitative data). (P4, P5)
- [Hypotheses and theories: Grades 9-12] Hypotheses are proposed explanations for a narrow set of phenomena. (P6)
- [Hypotheses and theories: Grades 9-12] Hypotheses are usually inspired and informed by previous research and/or observations. They are not guesses. (P6)
- NOS Matrix understanding category 1. Scientific investigations use a variety of methods.
- NOS Matrix understanding category 2. Scientific knowledge is based on empirical evidence.
- NOS Matrix understanding category 5. Science is a way of knowing.
- Science and Engineering Practice 2. Developing and using models
- Science and Engineering Practice 4. Analyzing and interpreting data
- Science and Engineering Practice 5. Using mathematics and computational thinking
- Science and Engineering Practice 6. Constructing explanations and designing solutions
- Science and Engineering Practice 7. Engaging in argument from evidence
It is easy to modify this lesson to emphasize the process of science. The lesson involves real data from field research. You can:
- Emphasize that science is done by people - in this case people in the filed making lots and lots of observations.
- Be explicit about data representation. Here students chart the lizard data on phylogenetic trees to make it easier to see the patterns. There is no one correct way to represent data.
- Be explicit about hypotheses generating multiple expectations. You can emphasize the core logic of scientific testing: "If this idea is right, what would I expect to observe?" Encourage students to be specific about these expectations and to generate multiple expectations for each hypothesis.
- Be explicit about data interpretation and ambiguity in science. In this lesson, though the lizard data generally support one hypothesis over the other, one group of closely related lizards is an imperfect match.
- This lesson demonstrates that doing "experiments" is not the only way to test ideas!
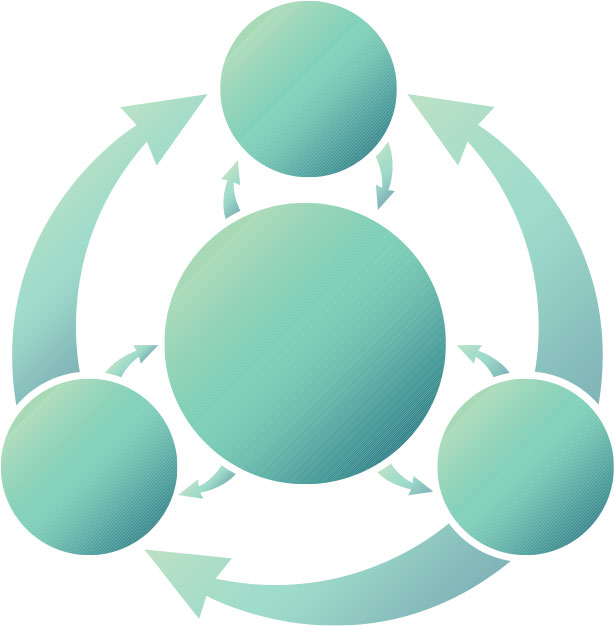
You can also apply the Science Flowchart. In the lesson, students made initial observations, asked questions, shared data, communicated with others, formed hypotheses, generated expectations, got more data, interpreted them, and concluded that they supported one hypothesis and opposed a different one. Have students trace their pathway through the flowchart to emphasize the nonlinearity of their activities.
