It’s easy to assume that science‘s “aha!” moments spring from unambiguous test results: “Aha! Starlight appears to bend exactly as predicted by general relativity — so Einstein must have been right!” “Aha! The number of hatchling crickets with mutant wings was exactly the number we’d expect if the gene for this trait were located on the X chromosome!” “Aha! No matter where I release it, the steel ball moves down the ramp with exactly the same acceleration — just as Galileo predicted!”
In fact, scientific results are rarely so clear cut. Einstein, for example, expected a particular degree of starlight shift (1.75 arc seconds, to be exact), but observers in 1919 recorded slightly different shifts (1.98, 1.61, and .93 arc seconds).1 And though Mendelian genetics led the scientists studying mutant cricket wings to expect one of their mating experiments to produce half mutant and half normal offspring, the experiment actually produced 160 mutants and 171 normal offspring — almost half and half, but not quite.2 And of course, any student of physics who has tried some version of Galileo’s famous experiment can attest to the fact that different trials yield slightly different acceleration values.
The world is a messy place — and many factors besides the theoretical ideas being tested can influence our observations. Just consider the simplified physics experiment of rolling a ball down a ramp to see if its acceleration is constant. Our observations of the speed and position of the ball are affected by the basic physics of motion (and its relativistic underpinnings) — but these observations are also affected by all sorts of mundane details. Air movement in the room, the precision of our measuring equipment, variations in the smoothness of the ramp and ball, and slight changes in how the ball is released can all end up affecting our observations. So if our observations don’t match the expectations generated by our knowledge of physics perfectly, does this mean that we should reject our basic understanding of physics? Or does it just mean that some of these other factors have nudged our results in one direction or the other? Most importantly, at what point do our observations deviate from our expectations so much that they must be viewed as contradictory evidence? Figuring all this out is a key part of data analysis and interpretation in science.
Closer than the alternatives
In many cases, the match between observations and expectations is relative. Scientists often compare alternative explanations which generate very different expectations. Observations may not exactly match either set of expectations, but if they are much closer to one set than the other, this can be viewed as evidence supporting the corresponding explanation. For example, in the case of the starlight shift test of general relativity, researchers compared the expected shift based on Einstein’s theory to the expected shift based on Newtonian mechanics. The graph here shows the two sets of expectations and the actual observations. It’s clear that though the data don’t match Einstein’s expectations perfectly, they fit that explanation much better than the Newtonian theory. This was interpreted as strong evidence in support of general relativity.
Larger sample, more confidence
The general relativity example also illustrates another tool used by scientists to separate informative trends from lesser influences: sample size. Often, all the minor factors that influence our observations have no regular pattern themselves and so will cancel each other out if many observations are considered together. If scientists studying general relativity had stopped with a single observation — say the star represented by the lowest point on the graph above — they might have concluded that Newton was right after all. However, additional observations revealed that the data more closely fit Einstein’s expectations. The deviation of that first observation from what we’d expect based on general relativity might have been caused by many different factors — an irregularity in the telescope lens or human error — but when many different observations are considered together, the most important pattern in the data is obvious. How many observations do we need? The answer depends, in part, on what we want to learn from the data. In general, the more subtle a discrimination we want to be able to make, the larger sample size is needed. Statistical calculations can often be used to figure out how large a sample is necessary to detect a difference of a certain magnitude.
How different is too different?
No matter how carefully controlled the experiment, how precise the observation, or how many times we repeat it, the data collected in a scientific investigation are likely to vary somewhat from each other and from our expectations. This is normal. Statistics can help us figure out if our results are within the normal range of expected variation — and how much our results would have to differ from expectations before we ought to suspect that the hypothesis or theory being tested is wrong. Many aspects of the natural world involve inherent uncertainty. While we are often able to figure out how probable different outcomes are, we may not be able to predict exactly what will happen in a particular situation. For example, in humans, the chance of giving birth to a girl as opposed to a boy is approximately 50%. (For reasons that scientists don’t fully understand, it’s actually around 49% girls to 51% boys.) However, it’s not possible to predict whether a girl or boy will be conceived in any particular natural pregnancy. However, we can predict that, in a large, random sample of pregnant women, about half will give birth to girls. If we find that our sample produces 55 girls and 45 boys, we probably shouldn’t throw out the idea of a 50/50 (or even 49/51) birth ratio, since some variation from sample to sample is expected. Several different statistical tests (including the chi-square test) can help us figure out exactly how “off” our observations would have to be before we should start getting suspicious of the idea of a 50/50 birth ratio.
TOO PERFECT A FIT?
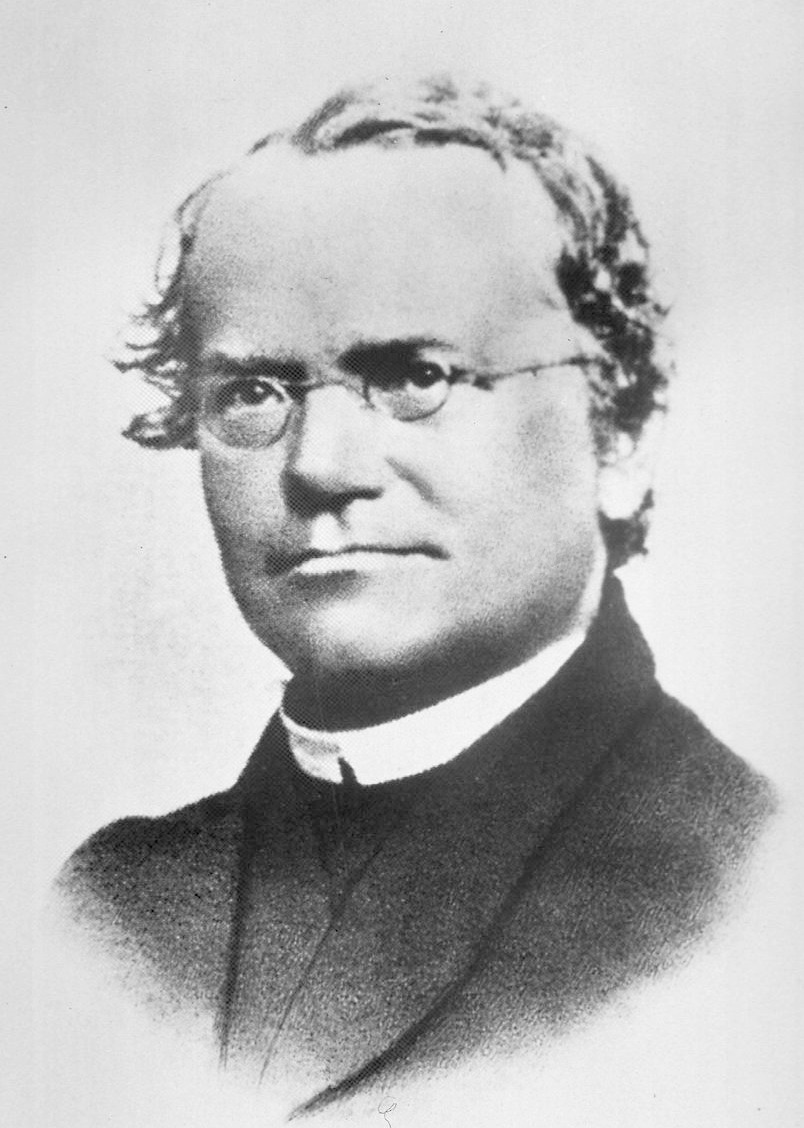
Scientists don’t count on their expectations and observations matching exactly because so many different factors can affect observations and test results. In fact, observations that too closely and consistently match expectations are sometimes taken as a warning sign of bias or fraud. For example, in the 1800s, Gregor Mendel performed many, now legendary experiments involving crosses of pea plants in order to learn more about inheritance. He was the first to notice the distinct hereditary patterns that were eventually recognized as the foundations of modern genetics. The only problem? Mendel’s data seem to be too good for too many of his experiments. In the 1930s, a prominent statistician pointed out that many of Mendel’s results matched his expectations surprisingly closely. For example, when Mendel expected a ratio of 3:1, he got ratios of 2.96:1 and 3.01:1. These observations (and supporting statistical analyses) led many scientists to wonder whether Mendel had “fudged” his data. After 70 years of debate and investigation into Mendel’s scientific ethics, modern scientists and historians can find no evidence that Mendel intentionally committed fraud. Nevertheless, because of the unusually close match between his expectations and observations, scientists continue to wonder exactly how his results wound up biased in support of his ideas.3
The suspicions raised about Mendel’s work didn’t end up pointing to actual fraud — but, in other cases, an unusually close match between observations and expectations or an unusually low degree of variation in test results are just the tip of the iceberg. For example, medical researcher John Darsee had published many papers on heart drugs before his colleagues noticed that he was incorrectly labeling his data. This tipped his supervisors off to a problem. They began to monitor his results more closely and soon noticed that his data were “too good” — they didn’t vary as much as similar data collected by others. Further investigation revealed that Darsee had been faking data for 14 years! More than 50 of his papers and abstracts were eventually retracted, he lost his job, and was barred from receiving research funding. “Perfect” results sometimes indicate poor scientific technique and ethics.
Take a sidetrip
To learn more about the Darsee case and misconduct, visit the National Academy of Engineering’s Online Ethics Center.
Finally, when considering how close a match between observations and expectations is reasonable, it’s important to remember that scientific testing is about identifying the best available explanation for a particular phenomenon — which may not be a perfect one. General relativity, for example, is currently the best explanation we have for understanding gravity, electricity, magnetism, and the movement of objects. It is supported by many lines of evidence and can be used to make accurate predictions about phenomena like the apparent shift in starlight traveling near a massive object. Indeed, later studies of this shift using satellites revealed a much closer match to Einstein’s predictions than the 1919 observations offer — but, of course, even these new observations are not always a perfect match. It is likely that the remaining deviations from expectations are caused by known factors that are simply too difficult to control — but we cannot rule out the possibility that that there is another, even better explanation still waiting to be discovered!
Learn more about the logic behind the starlight shift test of general relativity, in Fair tests in physics: Examining eclipses.
- Advanced: Visit the Visionlearning website for advanced material on how scientists quantify variability in their data and use statistics to deal with this variability.
1Dyson, F.W., A.S. Eddington, and C. Davidson. 1920. A determination of the deflection of light by the sun's gravitational field, from observations made at the total eclipse of May 29, 1919. Philosophical Transactions of the Royal Society of London, Series A 220:291-333.
2Tinghitella, R.M. 2008. Rapid evolutionary change in a sexual signal: Genetic control of the mutation 'flatwing' that renders male field crickets (Teleogryllus oceanicus) mute. Heredity 100:261-267.
3Franklin, A., A.W.F. Edwards, D.J. Fairbanks, D.L. Hartl, and T. Seidenfeld. 2008. Ending the Mendel-Fisher Controversy. University of Pittsburgh Press: Pittsburgh, PA.