• Skip to primary navigation
  • Skip to main content
  • Skip to footer
  • About
  • Translations
  • Image & Use Policy
  • Glossary
SUPPORT US
  • Email
  • Facebook
  • Twitter
UC MUSEUM OF PALEONTOLOGY
Understanding Science

Understanding Science

How science REALLY works...

Understanding Science

MENUMENU
  • Understanding Science 101
    • What is science?
    • How science works
    • The core of science: Relating evidence and ideas
    • The social side of science: A human and community endeavor
    • Science and society
    • What has science done for you lately?
    • A scientific approach to life: A science toolkit
  • For Educators
    • Prepare and plan
      • Guide to US 101
      • Conceptual framework
      • Correcting misconceptions
      • Educational research
      • Teaching tips
    • Find lessons and tools
      • Understanding Science infographics
      • How Science Works interactive
      • Teaching resource database
      • Using Science Stories
      • Image library
    • Teaching guides
      • K-2 teaching guides
      • 3-5 teaching guide
      • 6-8 teaching guide
      • 9-12 teaching guide
      • 13-16/college teaching guide
      • Teacher educators
    • Educator voicesEducators discuss how they use Understanding Science in their teaching
  • Science Stories
  • Science Flowchart
Home → Fair tests in the fossil record: Avoiding extinction
  • Snapshot
  • Designing a fair test of an idea — in formal science or in everyday life — means deciding what results you’ll be comparing, controlling variables, avoiding bias, and figuring out a way to distinguish chance differences from meaningful ones.
  • The same considerations regarding fair testing go into designing both experimental and non-experimental studies.
  • Controlled variables are those factors that are kept constant across a test, so that the effect of another variable can be better observed.

    Fair tests in the fossil record: Avoiding extinction

    Photos of Ann Budd (left) and Kenneth Johnson (right).
    Ann Budd and Kenneth Johnson. Photo credit: Ann Budd, University of Iowa.
    Three of the snail species used in the study. Shells shown to scale.
    Three of the snail species used in the study. Shells shown to scale.

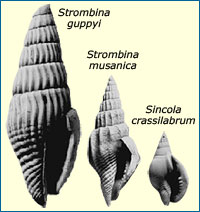
    Paleontologists Ann Budd and Kenneth Johnson were interested in the factors that affect a species’ odds of surviving an extinction event — specifically, whether or not small body size increases a species’ chance of survival. To ​​test this idea, they focused on a group of well-fossilized Caribbean snails (the genus Strombina) and studied many different species within this genus. Here’s the test they designed:

    • Comparing outcomes. Using studies of the fossil record, Budd and Johnson gathered information about which of the snail species in this genus were present both before and after a mass extinction event, and which went extinct. They compared the shell size of species that survived the extinction to the shell sizes of species that went extinct during the event. If small body size upped species’ chances of survival, the “survivor” group should have had smaller body sizes than the “extinct” group.
    Strombus gigas snails.
    To control variables, the researchers needed to figure out which specimens were adults. The thickness of a snail’s aperture lip can indicate whether the specimen is an adult. Though the species pictured here (Strombus gigas) was not used in the Budd and Johnson study, the difference in lip thickness is very obvious. The thick-lipped adult specimen is on the left.
    • Controlling variables. The researchers wanted the only difference between the two ​​samples to be whether or not the species in the sample had survived the extinction event. That meant limiting the study to a single genus of snails, so that species from one genus wouldn’t be over-represented in one of the samples; studying only adult snails, so that an excess of juveniles in one of the samples would not skew their results; and figuring out the actual shell size of snails with broken shells, so that this factor wouldn’t affect the size estimates for any sample.
    • Avoiding bias. To minimize the role of ​​subjective judgments in making the measurements, the ​​data on snail sizes were obtained using a consistent method for measuring the shells. In addition, the researchers who collected the snail data sometimes ran into a problem: too many fossils. Some snail species were represented by so many specimens that it would have been too time consuming to measure all the adults. How did they decide which specimens to measure? If the specimens had been hand-picked for measurement, the person selecting the snails could have biased the sample toward larger or smaller snails. Instead, the researchers identified a random subset for measurement so that personal bias couldn’t skew the data.
      Snail specimen being measured with calipers.
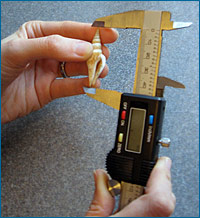
      The researchers obtained their measurements using a consistent method. Each snail specimen was measured from the tip of the spire to the base of the aperture.

      The researchers reasoned that this random subset would likely provide a representative sample of all the specimens of that species.

    • Distinguishing chance from real differences. To make sure that any differences they found were not due to random flukes, the same measurements were repeated on many, many fossils — 5099, to be exact, from 72 different species within this genus. In addition, Budd and Johnson used a statistical test to determine whether the difference they found in extinction rates was likely due to chance or to a real difference in odds of extinction.
    Graph showing size versus species.
    Size was not related to whether or not a species survived an extinction event. For each group of species, the mean size, maximum size, and minimum size are shown.

    In the end, the test suggested that being small offers little or no protection from extinction: there was no significant difference in the sizes of snails that survived the mass extinction event and those that went extinct. Because Budd and Johnson designed their test so fairly, we can be confident in these results.

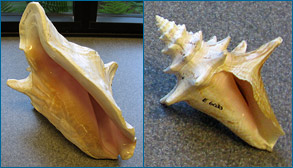
    Photos of snails used in the study from the University of Iowa's Neogene Marine Biota of Tropical America (NMITA) database.

    Footer

    Connect

    • Email
    • Facebook
    • Twitter

    Subscribe to our newsletter

    Learn

    • FAQs
    • Understanding Science 101
    • The science flowchart
    • Science stories

    Teach

    • Grade-level teaching guides
    • Teaching resource database
    • Journaling tool
    • Misconceptions

    Copyright © 2025 · UC Museum of Paleontology Understanding Science · Privacy policy

    We use cookies to see how our website is performing. We do not collect or store your personal information, and we do not track your preferences or activity on this site. Learn more about our Privacy PolicyOk